Profit & Cost Visibility
Understand margins, spending patterns, budget variances and the drivers behind unexpected changes.
Custom dashboards turn the data from your existing business tools into clear insights on employee performance, operating costs, and profitability.
Start with one important management goal. Build the reporting and analysis that helps your team move forward.
Understand margins, spending patterns, budget variances and the drivers behind unexpected changes.
Track key performance indicators in one place, with filters that help you investigate what changed.
Get recurring analysis, exception reviews and decision support without a full-time analytics hire.
Your existing software tracks tasks and transactions. My custom dashboards connect activities to business results, using KPIs designed around your goals.
Give managers and employees a consistent view of agreed-upon performance metrics. Recognize strong contributors, identify coaching opportunities, and support fairer, evidence-based performance reviews.
Example: A service manager compares completed jobs, turnaround times, rework rates and customer satisfaction. Employees see their own progress, while managers can track verified performance trends and use them for regular reviews — from weekly check-ins to annual evaluations.
Connect labor, materials, invoices and revenue to understand what each job or service actually costs—and where margins can improve.
Example: An auto repair shop compares labor costs, parts, rework and revenue across service categories to identify profitable work and pricing opportunities.
Bring financial, sales and operational information together to answer questions that reports from individual systems may leave unanswered.
Example: A construction owner compares estimated and actual labor and material costs, change orders and revenue to understand profitability by project.
No need to replace the software that already works. We start with your existing tools and build the management view your business needs.
Your business tools record what happens. Custom analytics help you understand what those activities mean for your people, costs, and profitability.
Give employees and managers a shared, reliable view of performance and progress.
Connect individual and team performance to measurable business outcomes.
Identify unnecessary spending, inefficiencies, and opportunities to improve margins.
Reduce manual reporting and give managers more time to focus on decisions.
These are portfolio demonstrations, not claims of financial results delivered to a client.
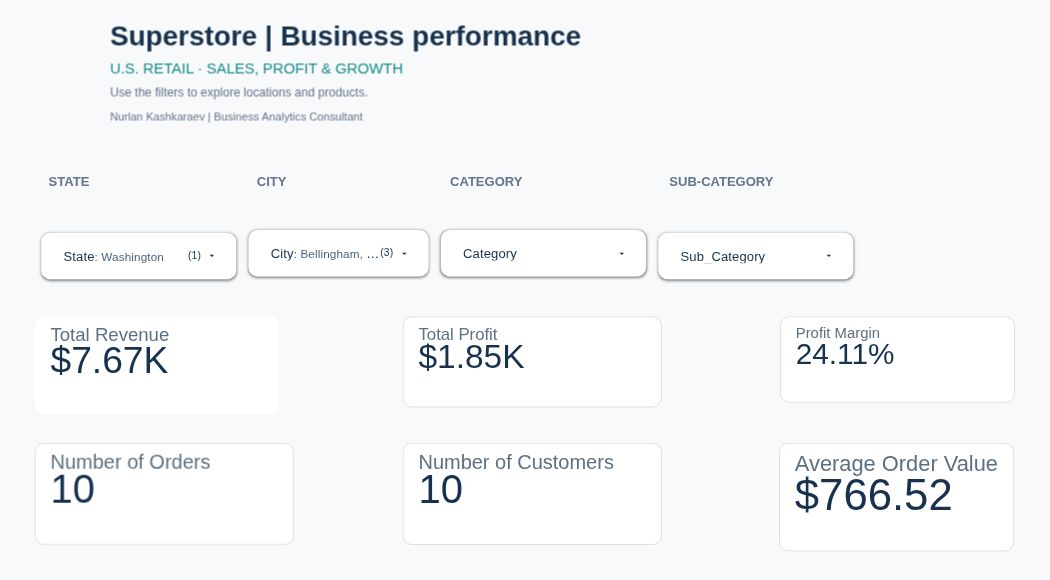
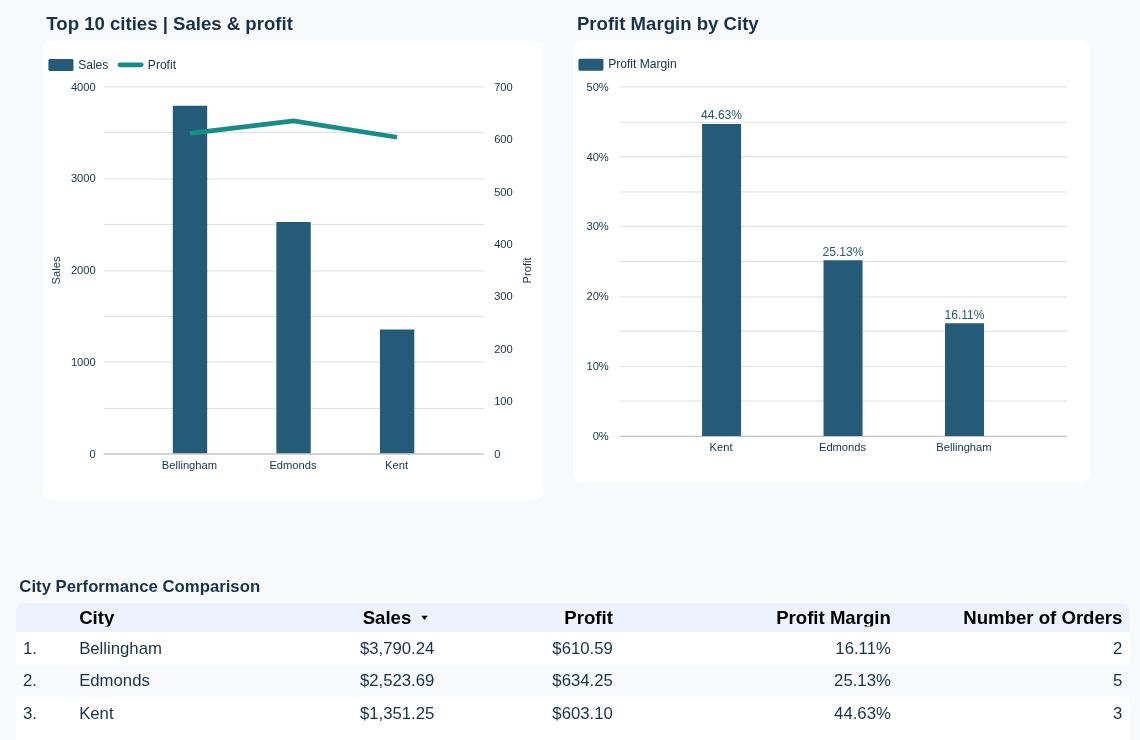
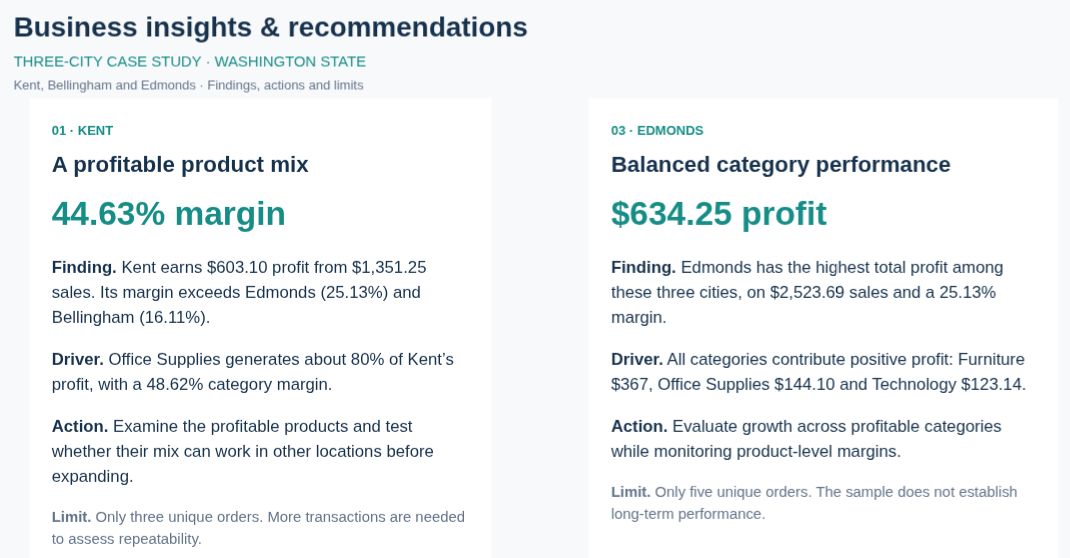
Explore where revenue differs from profit, how discounts affect margins, and which product categories or locations need attention.
I'm Nurlan Kashkaraev, MBA, a Seattle-area business analyst with experience in analytics and reporting initiatives across Amazon teams, including AWS Marketing and Last Mile operations.
I've worked with SQL, analytical data tables, dashboards and cross-functional teams to turn complicated business information into reporting that managers can use.
My focus is practical: clear numbers, early warnings, confidentiality and recommendations that help business owners make decisions.

Business Analyst & Analytics Consultant · Seattle, WA
Tell me what you would like to see more clearly—team performance, profitability, project progress or reporting across your tools. We can discuss a practical first step without a large commitment.
Email Nurlannurlank.sea@gmail.com · Seattle area, Washington